Every athlete has their own unique pattern of stride length and frequency. Striking the perfect balance between the two is one of the Holy Grails in sprinting because you cannot increase one without decreasing the other or vice-versa.
An equation for running speed is then:
(strides / second) * (meters / stride) = meters / second
When I saw Wayde van Niekerk run a new world record of 43.03 in the 400m, I immediately noticed that his running style was vastly different to that of the previous record holder, Michael Johnson. The latter was well known for his distinct upright stance and a short, choppy stride. Wayde, on the other hand, seems to be extremely springy and I wanted to know more about his stride length and frequency.
And so I did some research. I already had the split times from writing my previous blog about the record-breaking run and now I also counted all the strides for van Niekerk, Kirani James, LaShawn Merritt (all from their run in this year’s Olympic final) and Michael Johnson (from his record-breaking run of 43.18 from 1999 in Seville).
My main goal was to compare the new and the old world record holders (van Niekerk and Johnson), but I also decided to include Merritt and James to get a better sense of where van Niekerk differs from his main rivals.
The comparison tables below include data for each of the four athletes, but the charts only show van Niekerk and Johnson for the sake of better readability.
1) Splits*
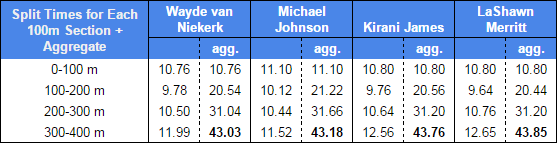

As I said in my previous blog, all three athletes from the 2016 Olympic final were ahead of Johnson’s world record pace at 300m because they started out incredibly fast. Johnson, however, ran a much more controlled race and he was able to cover the last 100m in 11.52; much faster than others. James and Merritt struggled and they didn’t even go under 12.5 seconds whereas van Niekerk had enough in the tank to hold on for the world record.
Click here to view all the 100m splits for all eight 2016 Olympic finalists.
Van Niekerk’s time without reaction time is 42.85 which is even faster than Michael Johnson’s fastest-ever 4x400m relay split of 42.94** from the 1993 World Championships in Stuttgart.
*The splits from the 2016 Olympic Final aren’t official and should be rounded to tenths instead of two-hundredths of a second like I did. I used my own methods to estimate the splits using a 50 fps video of the race, but it’s impossible to get conclusive and 100% correct splits.
**This time is taken from photo-finish pictures taken at the start and finish of Johnson’s leg supplied by Seiko. Using different methods, the DLV Biomechanics Report from Stuttgart variously shows times of 42.91 and 42.92.
2) Stride Frequency (steps per second)
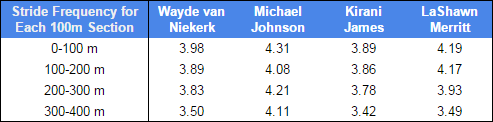

Stride frequency is always at its highest in the first 100m as athletes have to accelerate out of the blocks and get up to speed. Frequency then tends to drop because the rest of the race is all about maintaining a specific rhythm. Every one of our studied athletes follows this pattern, but it’s interesting to note that Johnson has a relatively substantial increase in the third 100m section of the race. This is in accordance with his famous race strategy of four P’s.
P1: Push hard for the first 100m and get up to speed as soon as possible.
P2: Pace yourself in the second 200m, meaning that you just sort of let your legs float without too much effort.
P3: Position. Make sure that you’re well positioned in the race and aren’t lagging behind others (that’s why it’s generally undesirable to run in the outer lanes where you can’t see your main rivals). You can never increase your speed at this point, but it’s where you usually have to increase your effort due to fatigue.
P4: Pray that your legs take you to the finish line as fast as possible.
Wayde threw the rule book and its old strategies out the window and (in his own words from Twitter and interviews) just went for it from the gun. He was running on the outside in lane 8, so he just focused on his own race and didn’t adjust his rhythm based on how others ran. This is reflected in his splits and stride frequency. Both got progressively worse over each sector, but he still maintained a great rhythm throughout the race.
Wayde is a religious man and I’d say that his race strategy isn’t four P’s, but rather just one. A ‘P’ that stands for Pray from gun to tape.
3) Number of Strides

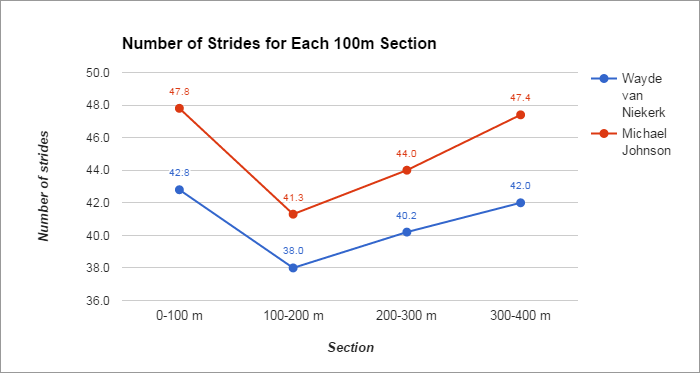
As we’ll see later, Wayde is the shortest of our four athletes, but he covers the 400m in virtually the same number of steps as the tallest one, Kirani James.
4) Stride Length
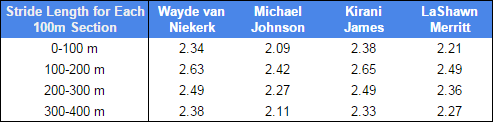

You’ll notice that this chart is just an inverse of the previous one with different numbers. Before we were talking about strides per second and now it’s meters per stride.
In any case, it firmly confirms my suspicion that van Niekerk has an extremely long stride. 2.63 m is a stride length that very few of the world’s best 100m sprinters can achieve while running at top speed (!), let alone in a 400m race where distribution of energy is essential to a good run. [Usain Bolt’s longest recorded stride length is 2.85 m from the last 20m of his 100m WR run.]
And while the much taller Kirani James has the longest recorded avg. stride (second sector), van Niekerk has a much longer avg. stride (and frequency) in the last 100m where it really counts and where James and Merritt were gradually starting to lose ground on the South African.
Up next is a direct comparison of height and average stride length.

Van Niekerk has the longest stride relative to his height. His average stride length in the race was 2.45 m, which is 1.34 times larger than his height of 1.83 m. Johnson has the lowest ratio as his avg. stride length of 2.22 m from his run was only 1.20 times his height of 1.85 m. James and Merritt are somewhere in between. Kirani James has the longest stride, but if he’d want to emulate van Niekerk’s ratio, he’d have to have an avg. stride length of 2.56 m!
Conclusion
- Michael Johnson has the highest frequency of the four, but the shortest stride length.
- Van Niekerk has an unusually long stride length relative to his height and a very good frequency.
So does stride length prove to be more important?
Not quite. Johnson just relied too much on frequency and while Wayde does rely more on stride length, he still manages to maintain a great frequency. It’s a killer combination and it’s similar to how Usain Bolt manages to dominate by having the same frequency as other (shorter) athletes, but a much longer stride.
Let’s use our equation from the opening paragraph to determine Johnson’s and van Niekerk’s average speeds based on their average stride length & frequency. Of course we can very easily calculate avg. speed by dividing total distance over total time, but here I’m just using our equation as proof of concept. The results differ slightly from the actual speed due to standard rounding errors and errors in determining the decimals of the stride length. The latter is never going to be entirely precise because it was extrapolated from the number of strides, which was in turn only estimated by eye from video. But the similarity of the two results confirms that my methodology was pretty good.
Michael Johnson:
(4.18 strides / s) * (2.22 m / stride) = 9.278 m/s
Actual speed: 400 m / 43.18 s = 9.264 m/s
Wayde van Niekerk:
(3.79 strides / s) * (2.45 m / stride) = 9.286 m/s
Actual speed: 400 m / 43.03 s = 9.296 m/s
Wayde van Niekerk simply has the best combination of stride length & stride frequency we have ever seen from a 400m runner. This would be true of any world record holder, but what is interesting about van Niekerk is that he is much more reliant on stride length.
Žiga P. Škraba

Very interesting analysis! Thanks for sharing it.
LikeLiked by 1 person
Over twenty years ago I wrote an article about USA 400 meter runners. What the article simply stated is that any 400 meter runner who could run under 20 seconds in the open 200 meters is capable of running 43.0 or better if they are willing to get in the right condition. I have been using that type of conditioning program for over 20 years at the high school level.
LikeLiked by 1 person
Awesome analysis! Thanks for posting. Would you be able to do such an analysis for distance runners? Say Laura Muir compared to Jenny Simpson and Genzebe Dibaba. Or Mo Farah compared to Kennesia Bekele? I’d be very interested to see how they compare, just don’t have the know how to measure it all. Thanks for this intersting blog post!
LikeLiked by 1 person
Thanks, I appreciate it. To answer your question, it probably wouldn’t be a problem for the 1500m (and I might do some in the future) because those races are often shown from start to finish. The problem with longer distances is that they’re not shown in full and I can’t do a full analysis for the entire race, but I need video footage (high frame rate is a plus) for some of my data collecting.
LikeLike
Nice job.
Too say that MJ “just relied too much on stride frequency” is a bit unfair. He did after all hold the WR for quite a few years before it was broken, plus he did split 42.9 in the 4×400. He did quite well in his day. And his day lasted for 20 years.
LikeLiked by 1 person
Yeah, I agree with you. I can see now how that sentence might sound a bit odd, but it wasn’t my intention to make it look like Johnson had a weak technique or anything like that. In fact, one of the underlying messages of this post is that while Johnson and van Niekerk have very different running styles in regards to stride length/frequency, they still ran two of the fastest times in history.
LikeLike
Nice Job!
So do you see Kirani James breaking van niekerk record any time soon?
LikeLike
Thanks!
But no, I don’t. Kirani is an incredible talent and he’s one of my favourite athletes on and off the track, but he needs to make some changes to his regime because he just can’t seem to break 43.7.
LikeLike
Very interesting. This does not take into account intangibles. The most important factor in maintaining speed in the last portion of the 400 is the ability to “relax”, by this I mean the ability to use the needed muscles while not tensing muscles not needed. Johnson was likely the best at this ability which helps reduce the build up of lactic acid. Johnson’s upright stance was not as unique as some think. Watch Jesse Owens and Henry Carr (1960 200m). No one can be a top level 400 runner without being able to control the tension in his or her muscles. This is more difficult for female runners since their race lasts six or seven seconds longer.
LikeLike
Just wondering if it is possible for you to work out Butch Reynolds splits for his 43.29. Bearing in mind he was not as fast as these guys at 200m
LikeLike
I already know them from another research (not mine). They are: 11.2, 21.4, 32.1, 43.29 (11.2 + 10.2 + 10.7 + 11.2). He ran an incredibly even pace throughout his race.
LikeLike
Is interesting how the modern day guys managing to do a sub 10 split at some point in the race yet with the exception of van niekerk they have not gone faster than Johnson and Reynolds. Furthermore all the splits show the backstretch is where the guys are putting their fastest times in regardless of the different tactical approaches to the race.
LikeLike
Is there any chance you can get the split for Cedenio who finished 4th, set a national record of 44.01 and in doing so became the fastest person to run a 400m and not medal?
LikeLike
Sure, 10.90 + 9.90 + 11.00 + 12.21 (20.8 at 200m, 31.8 at 300m).
LikeLike
No one is addressing the conditioning program it takes to carry the speed any athlete has over the 400m distance. Take a look at the 1988 Olympic 400m race where the slowest 200m person won but by using the same strategy as 2016 was very successful.
LikeLike
Very well done. Did Michael congratulate him afterwards or call him?
LikeLiked by 1 person
Johnson was professional about it and to me he seemed very proud of van Niekerk. He even wrote on Twitter that he thinks the WR is in safe hands now. You can hear his initial reaction on YouTube, just type ‘johnson reaction to van niekerk’ and it should be one of the top hits.
LikeLike
Hi Ziga,
excellent job! Very interesting! Do you think this type of analysis can be used to modify the way of running of some athletes in order to improve their performance or we should assume that everybody has his/her way of running and should not be touched significanltly?
Thank you
Marco
LikeLike
That’s an interesting question, but I can’t really say for sure. We mustn’t forget that even 2.22 m (Johnson) over 400m is a very long average stride length.
The one thing that I purposefully ignored in this article is force production. Van Niekerk (and other elite sprinters) can strike the ground much harder and have a much shorter ground contact time than normal people. I mean you could train people to run with a 2.5 m stride length, but most of them would essentially just be hopping from one leg to the other because they still couldn’t produce enough force when hitting the ground and their ground contact time would be half a second instead of 0.150 seconds or lower. This means a lower frequency and a slower running speed.
In short, it’s very hard to modify.
LikeLike
Know that you took into account height vs stride length to conclude their relative stride length. Do you think this could change if you were able to only look at leg or even femoral length? Just remembering Johnson seemingly had a long torso, which could have been more noticeable due to his running style. Great post with informative/useful conclusions.
LikeLike
Leg length relative to height would be very helpful to my research, but there’s just no way to get that info, sadly.
LikeLike
Interesting analysis, it seems that there’s no right way to run the 400m and the fastest runners are the ones that overcome their relative weaknesses given their structural anatomy i.e. faster cadence for a tall runner, longer stride length for a shorter runner.
LikeLike
Great analysis and subsequent thoughtful and insightful comments.
LikeLiked by 1 person
Very nice analysis! Thank you.
We don`t really need it for the conclusion: “Wayde van Niekerk simply has the best combination of stride length & frequency we’ve ever seen from a 400m runner”… well, he is the fastest ever…
LikeLike
Seems that the tactic in running the 400m changed watching the splits of Johnson and Reynolds, and the one of Niekerk Merrit and James, they go close the maximum in the first 300m and then try their best in last 100m.
LikeLiked by 1 person
I think Lincoln has hit upon an important part of the equation. Just how long are the legs of each runner. I think that would be an important aspect to the overall evaluation.
LikeLiked by 1 person
Do you think there are any variables that would affect the analysis of the women’s Olympic 400M? Would love to see the breakdown between Allyson and Shaunae
LikeLike
The obvious difference between them is height, so it would be interesting to see their stride pattern. I might do a similar analysis for them and publish it if I find anything particularly interesting about it.
LikeLike
Hi Ziga, your pretty smart. Do you ever exchange emails with curious readers?
LikeLike
You can find my email in the ‘about me’ section of the blog.
LikeLike
I have read that Michael Johnson trained specifically to break the world record. His coach set him up with extra training that focused purely on running the last 100m in under 12 seconds under fatigue. That training paid off….his words.
If you look at the last split of all runners, those that ran under 12 seconds for the last 100m broke the records.
LikeLiked by 1 person
Once again I find myself reading and analyzing this article. This really is a beautiful piece. When looking at Michael Johnson’s and Wayde’s 200m and 300m PB’s of 19.32 and 30.85A vs 19.94 and 31.03 respectively, do you believe Michael Johnson could have broken 43 seconds? Although his last 200m was 21.96 his first 200 was 21.22 which is 1.9 seconds slower than his 200m PB, do you think him running his first 200m as quick as Wayde, if not quicker, would have broken him or could it have propelled him to a sub 43 second run?
LikeLiked by 1 person
Thanks, I appreciate the kind words. As for Johnson and him running the same tactic as van Niekerk, it’s hard to say what his time could have been. His 200m speed seems to suggest that he could have run much faster in the first half of the race, but as I hinted in my analysis, he might have been hampered by too much planning (the 4 P’s and all that). Of course we can never know for sure if someone reached their full potential, but Johnson posting 22 sub-44 runs in his career leads me to believe that 43.18 was very close to his limits.
And let’s not forget that Johnson’s fastest 4x400m flying split of 42.94 was slower than van Niekerk’s time without reaction.
LikeLike
Some good points listed there. Thank you for you response and article once again.
LikeLiked by 1 person
This article is really interesting. I have bookmarked it.
Do you allow guest posting on your website ? I can write hi quality posts for
you. Let me know.
LikeLike
I can answer to such questions if you contact me personally through any of the listed social media links.
LikeLike
Would be interesting to see the other 5 runners stats – they also run in an Olympic final after all! Would be interesting to include the weight of the athletes in the analysis. Would be interesting to see the same stats for some other top runners from 20 years ago – to see if Michael Johnson was running differently compared to his generation or his generation was running differently compared to today’s runners.
LikeLiked by 1 person
Micheal Johnson did not run a race with athletics as fast as Van Niekerk . If Johnson ran with two other runners all going under 44 seconds who knows he could have got faster times.
Mostly in all his races by 250 meters he is already in the lead.
He has the best finish over the last 200 meters.
LikeLike
There were faster finishers than Johnson (Reynolds for example), but with a slower first half. It’s all about balance and speed reserve in the 400m, so it’s tough to predict what someone could run.
LikeLike
Hi what sources did you use to find these stride lengths, frequencies, etc.?
LikeLike
I worked them out myself using a 1080p 60fps video and replays of the race.
LikeLike
thanks bro,
i was bit confused about the stride length but your article helped me a lot
LikeLike
Nice analysis, what about considering not height but inseam?
LikeLike
amazing and THANKS!!! to run a great 400 could you translate?? fast cadence (get out FAST)…then slower cadence coming in , but what happens to the stride length?? shorter or longer?? sorry if this is stupid. Trying to get my head around this!
LikeLike